


How to Audit Your Workplace Operations Systems: A Step-by-Step Guide


Something is slowing your office down, and you can feel it even if you can't name it yet. Meetings get moved twice before they happen. Someone shows up expecting their full team to be in and instead finds an empty office floor. A "booked" room turns out to be empty for the whole hour, while three people wander the hallway looking for a quiet place to take their calls.
That's workplace friction: the everyday breakdowns in room booking, desk availability, AV, coordination, and policy that make the office harder to use than it should be.
Add up enough of these moments across a year, and you get what a recent study of 514 workplace professionals calls the coordination tax: the time (read: money) employees lose each week working around broken systems. For a 1,000-employee organization, that tax runs between $4.5 million to $9 million a year.
The same study found that in the most disconnected organizations, 63% of employees say this kind of friction hinders their productivity. If you want the full data behind those numbers, including where your own organization is likely to land, the Workplace Friction Report 2026 is worth reading alongside this guide.
If any of this workplace friction sounds familiar and you’re ready for an office reset, this guide is for you. Below is a simple audit template that maps where your workplace data lives, where it overlaps, and where it's missing — the visibility you need before you can pinpoint where your office's friction actually starts, let alone fix it.

Before You Answer Anything, Build Your Inventory and Map
Two setup tasks come before the real questions. Skip them, and you'll be answering from memory instead of from evidence.
Inventory all your systems.
List every place a workplace request or piece of data lives. Include what it's for, who owns it, and what information it actually holds. Start with the official platforms, but don't forget the more subtle workarounds like the spreadsheet someone built three years ago that one department still depends on, or the Slack channel that's turned into your ticketing system for AV complaints.
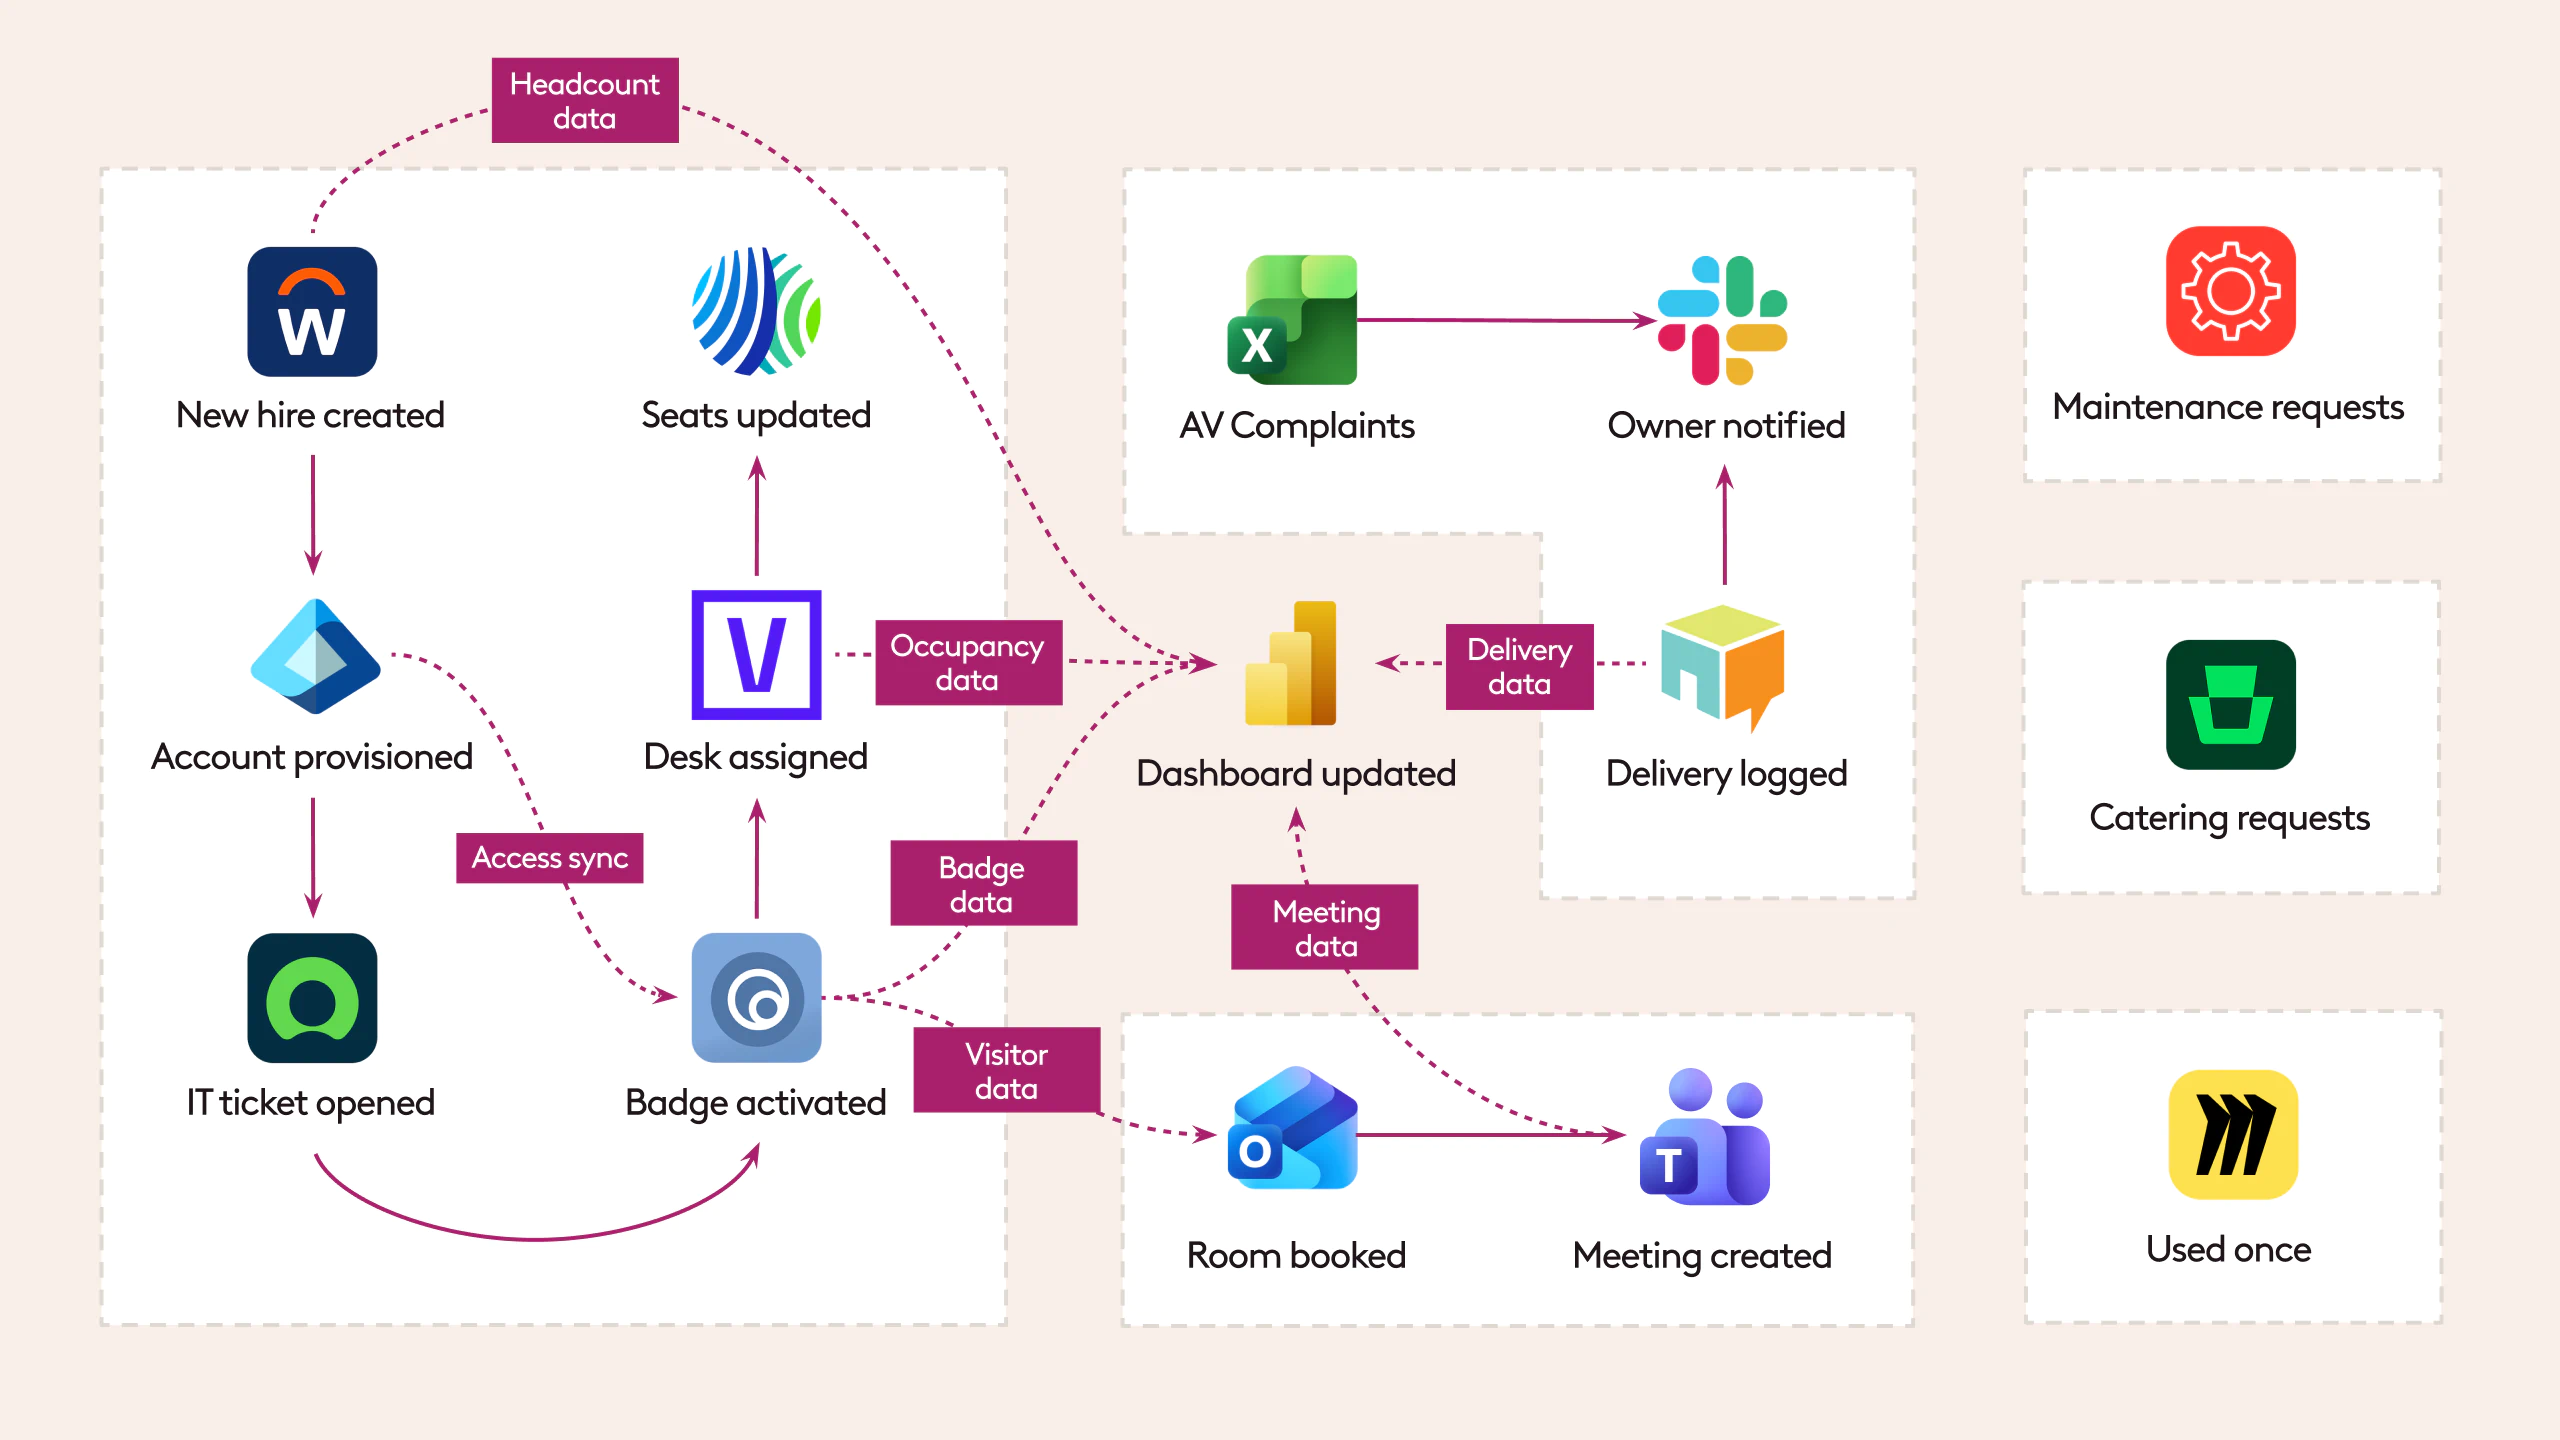
Map how information moves.
Trace how requests and data flow through everything on your list. Which systems and people share information, and which ones operate in their own bubble? This map is what makes the three questions below answerable instead of guesswork.
The Three Questions Your Audit Needs to Answer
With your inventory and map in hand, these three questions cut straight to what matters: where your systems are duplicating effort, where data is missing entirely, and where the process breaks down for the people using it every day. Answer them honestly, and you'll know exactly what to fix to make your office run smoother.
Question 1: Which parts of the process are doing overlapping work?
Look at your map for duplicate coverage: two tools handling room booking, or two people separately tracking desk assignments in two different spreadsheets. Overlap is where time and budget quietly leak out, whether the redundancy lives in software or in someone's manual routine.
Question 2: Where is the data missing entirely?
Most organizations, whether they're running on five tools or zero, share the same blind spots: how employees actually use the office space after they arrive, whether people are showing up for their meeting room reservations (also known as ghost meetings), and where/when teams collaborate once they're in the office.
Here's a quick list of questions to identify any similar data gaps you have today. Run through these and be honest about which ones you can answer with your data today:
- Which days or times see the heaviest space usage, and does that match your staffing or scheduling assumptions?
- How much space sits unused on your lowest-attendance days?
- What's your no-show rate on booked conference rooms?
- Of employees who plan to come into the office on a given day, what's the actual attendance rate?
- What percentage of meetings start late or get moved because of tech issues?
- How many AV-related IT tickets for conference rooms do you get per week?
Question 3: Where is the current process failing?
Remember: in the most disconnected organizations, 63% of employees say friction is dragging down their productivity, compared to just 14% in the most connected ones. Now that you've identified your data gaps in the above section, it's time to check in with your team and see whether they're feeling the downstream impact.
Start by interviewing end users for 15 minutes each. Ask about their biggest headaches with the office, which tools they actually use day to day, and any workarounds they've built for themselves.
Then turn to your own workplace team. Ask where they're flying blind like where they're making calls without reliable data, fielding the most complaints, or running reports that don't line up with each other.
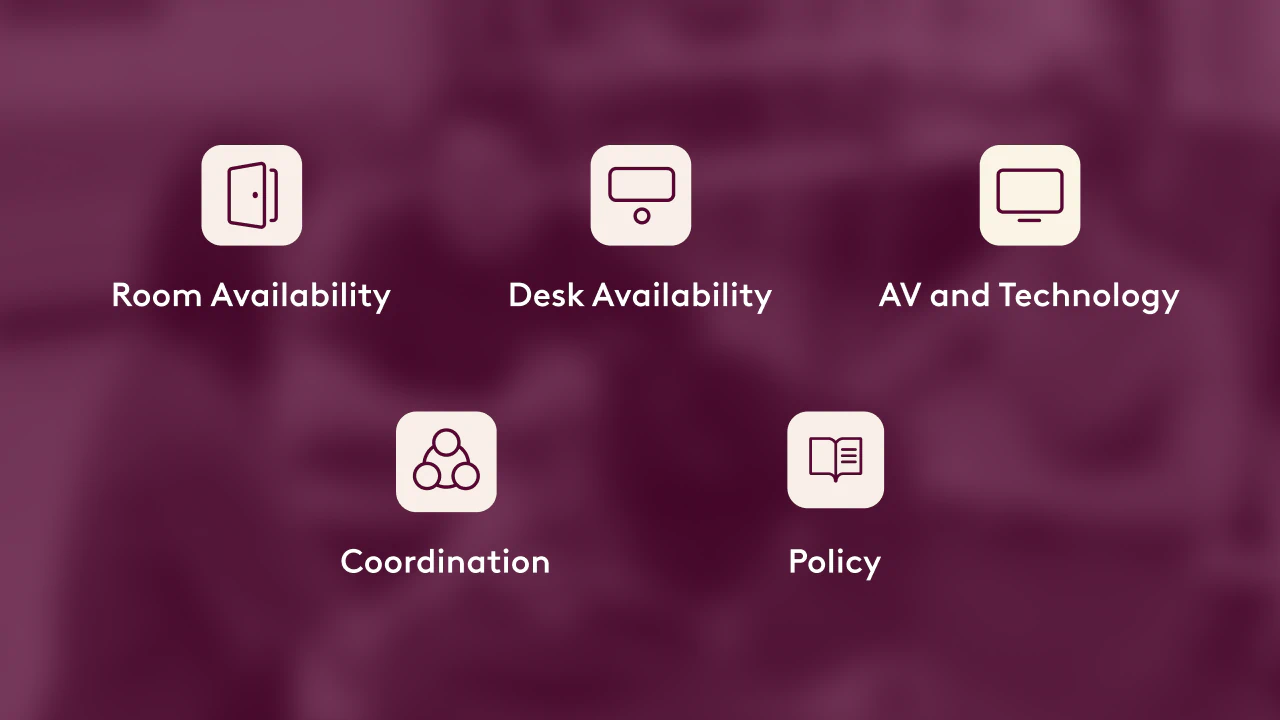
How to Map Out Your Findings
Once you've got answers to all three questions above, document the most common issues across five categories: room availability, desk availability, AV, coordination, and policy. Note how often each one shows up.
How Do You Prioritize Findings From a Workplace Audit?
Prioritize the findings of your workplace audit by tracing each symptom back to its shared root cause instead of fixing whichever one is loudest. In other words, treating five symptoms as five separate problems is the mistake that trips most people up.
Say your map shows room availability lighting up as the biggest pain point. The instinct is to go fix room booking. Resist that urge!
Instead, cross-reference the finding against your entire audit. Almost always, that "room" problem is the loudest expression of a deeper gap, one that's also showing up in desk booking, in coordination, in policy confusion. It just hasn't gotten loud enough there yet for anyone to notice.
Think of it like a leak in your roof. Water shows up on the ceiling in the kitchen. You could patch the ceiling. But if the leak is actually three feet over, in the attic, patching the kitchen ceiling just buys you a few quiet months before the water finds a new place to drip.
Here are a few other best practices for sorting what you found:
Separate your overlaps from your gaps. Overlaps are where you can often consolidate tools and save money, or simplify if the overlap is duplicated manual effort. Meanwhile, gaps are typically where you need to add capability, whether you're starting from nothing or building onto what already exists.
Trace every gap back to its root. For example, a missing real-time occupancy signal doesn't just show up as bad desk booking — it shows up as ghost meetings, when someone books a room and then hops on the call remotely instead. It also shows up as complaints about wasted commutes, when someone comes in to collaborate with teammates who turn out to be remote that day. Patch desk booking alone, and those other two symptoms don't go anywhere, because the actual gap (no shared occupancy data) was never touched.
Fix the platform layer, not the point fix. It helps to think of your audit results in two layers. The symptom layer is where friction actually gets reported: room complaints, desk complaints, AV tickets, coordination confusion, policy questions. The platform layer is the shared (or missing) layer of data underneath that's supposed to connect rooms, desks, visitors, services, and coordination in real time.
A lot of complaints piling up in one category on the symptom layer is rarely a sign that a single tool is broken. It's a sign that the platform layer underneath needs attention. Patch the symptom layer with a standalone tool, and the gap doesn't close, friction just relocates to another dimension. Fix the platform layer instead, and every symptom tied to it improves at once.
What Does a Consolidated Platform Layer Look Like?
A consolidated platform layer is one shared data layer where rooms, desks, visitors, services, and coordination all talk to each other automatically. This is what separates organizations that actually fix workplace friction from the ones stuck patching the same leak every quarter.
That unified platform creates a single source of truth, helping teams use data to inform every decision after it, from room design to desk ratios to catching the next friction point before it becomes a pattern.

athenahealth is a good example of this in practice. Employees were manually checking into desk reservations, and when someone forgot, the system could release their desk automatically, frustrating the employee and creating a quiet hole in the attendance data.
But instead of patching their check-in flow, athenahealth instead integrated its badge access system with Robin’s workplace operations platform, so employee presence confirmed itself automatically and reconciled with reservations in real time.
"We wanted to make the best use of the spaces we do have," said Brittany Freeman, Director of Workplace Experience at athenahealth. "We didn't want to be reactive in making choices; we wanted to use data. That's where Robin comes in."
With that cleaner picture of utilization, athenahealth found a floor that was quietly underused and turned it into a flexible training center..
Where to Start This Week
You can't prioritize what you can't see, and you can't build a credible case to leadership without evidence. An audit gives you both: a clear picture of what's actually happening, and the receipts to back up whatever you decide to do next.
Get started by breaking it into three moves:
- Block two hours for the inventory. Just the list of tools and manual processes. Nothing else. Resist the urge to solve anything while you're building it.
- Pick one friction dimension and map the data gap for that dimension only. Don't try to boil the ocean on your first pass.
- Talk to three end users and one workplace operations team member about where they work around the current process most. Their answers will tell you more than any dashboard you currently own.
That's it. Once you've mapped your gaps, you're ready to turn what you found into a business case leadership will actually act on.
Robin can walk through this audit with you and show you what a consolidated platform looks like based on what you find, whether you're replacing a fragmented stack or building your workplace tech from the ground up.




.jpeg)


